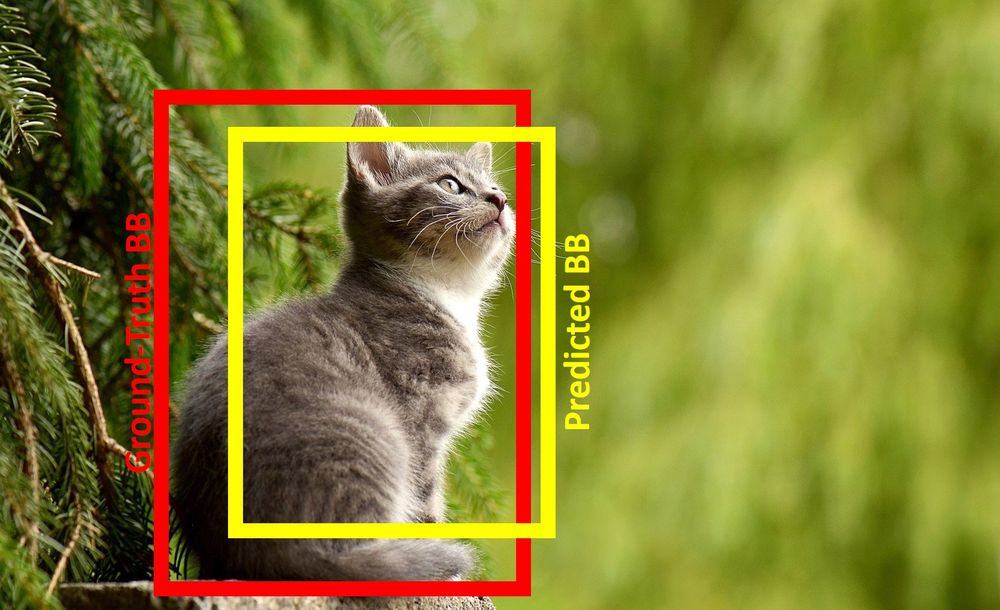
mAP (mean Average Precision) is a common metric used for evaluating the accuracy of object detection models. The mAP computes a score by comparing the ground-truth bounding box to the detected box. The higher the score, the more precise the model's detections.
The following articles give a good overview of the concepts of precision, recall, mAP, etc.
https://jonathan-hui.medium.com/map-mean-average-precision-for-object-detection-45c121a31173
https://blog.paperspace.com/mean-average-precision/
https://blog.paperspace.com/deep-learning-metrics-precision-recall-accuracy/
https://www.narendranaidu.com/2022/01/confusion-matrix-for-classification.html
Some snippets from the above article:
"When a model has high recall but low precision, then the model classifies most of the positive samples correctly but it has many false positives (i.e. classifies many Negative samples as Positive). When a model has high precision but low recall, then the model is accurate when it classifies a sample as Positive but it may classify only some of the positive sample.
Higher the precision, the more confident the model is when it classifies a sample as Positive. The higher the recall, the more positive samples the model correctly classified as Positive.
As the recall increases, the precision decreases. The reason is that when the number of positive samples increases (high recall), the accuracy of classifying each sample correctly decreases (low precision). This is expected, as the model is more likely to fail when there are many samples.
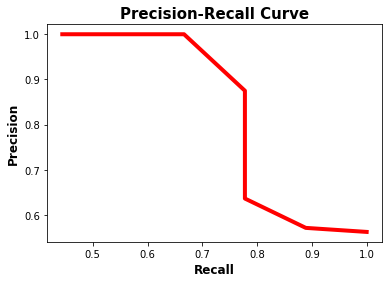
The precision-recall curve makes it easy to decide the point where both the precision and recall are high. The f1 metric measures the balance between precision and recall. When the value of f1 is high, this means both the precision and recall are high. A lower f1 score means a greater imbalance between precision and recall.
The average precision (AP) is a way to summarize the precision-recall curve into a single value representing the average of all precisions. The AP is the weighted sum of precisions at each threshold where the weight is the increase in recall.
The IoU is calculated by dividing the area of intersection between the 2 boxes by the area of their union. The higher the IoU, the better the prediction.
The mAP is calculated by finding Average Precision(AP) for each class and then average over a number of classes."
No comments:
Post a Comment