Showing posts with label Computer Vision. Show all posts

Tuesday, August 05, 2025

Steps for training a custom document extraction model on Azure AI

Given below is a step-by-step guide on how to use bounding boxes to train custom document models in Azure Vision + Document AI:

Step 1: Prepare Your Document Samples

Collect a minimum of about 5-10 sample documents representative of the type you want the model to learn. Ensure the documents contain the fields or visual elements you want to extract (e.g., invoice numbers, tables, checkboxes).

Step 2: Upload Documents to Azure Document Intelligence Studio or AI Foundry Portal

Navigate to the Azure Document Intelligence Studio or the AI Foundry portal. Create a new custom model project and upload your labeled documents here.

Step 3: Annotate the Documents with Bounding Boxes

Open each document in the annotation tool. Use the interface to draw bounding boxes around each field or element you want your model to detect. For example, draw a rectangle around the "Invoice Number" field or the table area. Assign a meaningful label/tag to each bounding box (e.g., "InvoiceNumber," "TotalAmount," "Table").

Step 4: Review and Adjust Annotations

Carefully review each bounding box for accuracy and completeness. Adjust sizes and positions as needed to tightly encase the relevant text or visual elements.

Step 5: Train the Custom Model

Once all documents are annotated, start the training process. The AI will learn to recognize visually similar regions and extract text or data associated with each labeled bounding box.

Step 6: Evaluate the Model

Test the model using a set of new, unseen documents. Review the extracted fields to check accuracy and completeness. If necessary, add more labeled documents or refine annotations and retrain.

Step 7: Deploy and Use the Model

When satisfied with the model’s performance, deploy it via the Azure portal. You can now integrate the model through APIs or SDKs to automate document processing in your applications.

This bounding-box annotation process is crucial for training effective custom document AI models in Azure Vision + Document AI, ensuring the system understands exactly where and what information to extract from documents.

Azure Vision + Document AI supports two main types of custom models:

  1. Custom Template Model (formerly Custom Form Model): Best for documents with a consistent and static layout or visual template (e.g., questionnaires, structured forms, applications). Extracts labeled key-value pairs, selection marks (checkboxes), tables, signature fields, and regions from documents with little variation in structure.
  2. Custom Neural Model (also called Custom Document Model): Designed for documents with more layout variation, including structured, semi-structured, or unstructured document types (e.g., invoices, receipts, purchase orders). Uses deep learning trained on a base of diverse document types and fine-tuned on your labeled dataset. Recommended for higher accuracy and advanced extraction scenarios when documents vary in layout or complexity. 
The custom neural model in Azure Vision + Document AI is based on Microsoft's proprietary deep learning architecture specifically designed for document understanding. It as a deep learning model trained on a large collection of documents and then fine-tuned on your labeled dataset to recognize key-value pairs, tables, selection marks, and signatures in structured, semi-structured, and unstructured documents. 

Behind the scenes, the architecture likely combines convolutional neural networks (traditional Computer Vision CNN like YOLO) for layout/visual understanding together with transformer-based LMMs (large multi-model models) or sequence models for text and contextual understanding. This hybrid use of vision and language models is what enables the service to process multi-modal inputs (visual layout plus text) effectively.

Important Note: Before you embark on creating a custom fine-tuned neural net model, please check if your usecase can be satisfied with the pre-built models (which will be true for 90% of the usecases).

A lot of usecases can just be fulfilled by using the "Layout analysis model with the optional query string parameter features=keyValuePairs enabled"


Monday, August 29, 2022

mAP (mean Average Precision) and IoU (Intersection over Union) for Object Detection

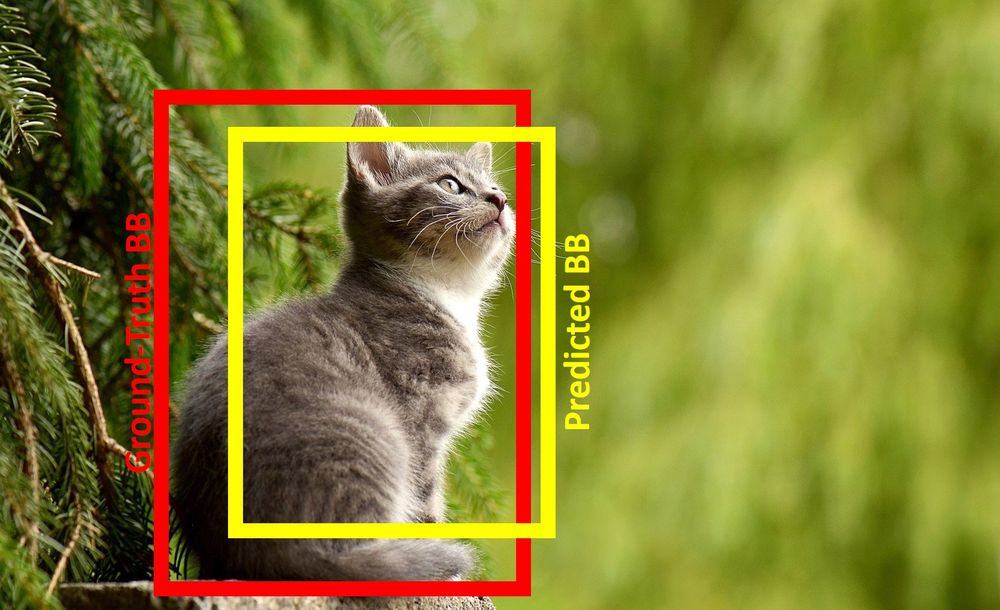
mAP (mean Average Precision) is a common metric used for evaluating the accuracy of object detection models. The mAP computes a score by comparing the ground-truth bounding box to the detected box. The higher the score, the more precise the model's detections.

The following articles give a good overview of the concepts of precision, recall, mAP, etc. 

https://jonathan-hui.medium.com/map-mean-average-precision-for-object-detection-45c121a31173

https://blog.paperspace.com/mean-average-precision/

https://blog.paperspace.com/deep-learning-metrics-precision-recall-accuracy/

https://www.narendranaidu.com/2022/01/confusion-matrix-for-classification.html

Some snippets from the above article:

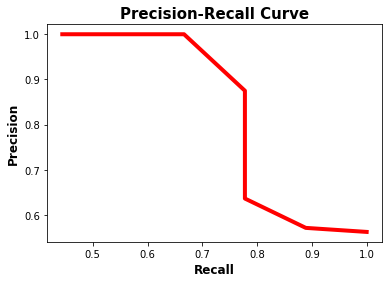
"When a model has high recall but low precision, then the model classifies most of the positive samples correctly but it has many false positives (i.e. classifies many Negative samples as Positive). When a model has high precision but low recall, then the model is accurate when it classifies a sample as Positive but it may classify only some of the positive sample.

Higher the precision, the more confident the model is when it classifies a sample as Positive. The higher the recall, the more positive samples the model correctly classified as Positive.

As the recall increases, the precision decreases. The reason is that when the number of positive samples increases (high recall), the accuracy of classifying each sample correctly decreases (low precision). This is expected, as the model is more likely to fail when there are many samples.


The precision-recall curve makes it easy to decide the point where both the precision and recall are high. The f1 metric measures the balance between precision and recall. When the value of f1 is high, this means both the precision and recall are high. A lower f1 score means a greater imbalance between precision and recall.

The average precision (AP) is a way to summarize the precision-recall curve into a single value representing the average of all precisions. The AP is the weighted sum of precisions at each threshold where the weight is the increase in recall. 

The IoU is calculated by dividing the area of intersection between the 2 boxes by the area of their union. The higher the IoU, the better the prediction.


The mAP is calculated by finding Average Precision(AP) for each class and then average over a number of classes."

Saturday, March 26, 2022

Ruminating on Convolutional Neural Networks

Convolutional Neural Nets (CNNs) have made Computer Vision a reality. But to understand CNNs, we need to get basics right - What exactly is a convolution? What is a kernel/filter?

The kernel or filter is a small matrix that is multiplied by the source image matrix to extract features. So you can have a kernel that identifies edges or corners of a photo. Then there could be kernels that detect patterns - e.g. eyes, stripes.

A convolution is a mathematical operation where a kernel (aka filter) moves across the input image and does a dot product of the kernel and the original image. This dot product is saved as a new matrix and is called as the feature map. An excellent video visualizing this operation is available here - https://youtu.be/pj9-rr1wDhM

Image manipulation software such as Photoshop also use kernels for effects such as 'blur background'. 

One fundamental advantage of the convolution operation is that if a particular filter is designed to detect a specific type of feature in the input, then applying that filter systematically across the entire input image allows us to discover that feature anywhere in the image. Also note that a particular convolutional layer can have multiple kernels/filters. So after the input layer (a single matrix), the convolutional layer (having 6 filters) will produce 6 output matrices. A cool application to visualize this is here - https://www.cs.ryerson.ca/~aharley/vis/conv/flat.html

A suite of tens or even hundreds of other small filters can be designed to detect other features in the image. After a convolutional layer, we also typically add a pooling layer. Pooling layers are used to downsize the features maps - keeping the important parts and discarding the rest. The output matrices of the pooling layer are smaller in size and faster to process. 

So as you can see, the fundamental difference between a densely connected layer and a convolutional layer is that dense fully connected layers learn global patterns (involving all pixels) whereas convolution layers learn local features (edges, corners, textures, etc.) 

Using CNNs, we can create a hierarchy of patterns - i.e. the second layer learns from the first layer. CNNs are also reusable, so we can take an image classification model trained on https://www.image-net.org/ dataset and add additional layers to customize it for our purpose. 

A good introduction to CNN models is given in this article - https://towardsdatascience.com/convolution-neural-networks-a-beginners-guide-implementing-a-mnist-hand-written-digit-8aa60330d022 with a good PyTorch implementation for MNIST dataset here - https://towardsdatascience.com/mnist-handwritten-digits-classification-using-a-convolutional-neural-network-cnn-af5fafbc35e9

Wednesday, December 29, 2021

Computer Vision Use Cases

viso.ai has published a series of interesting posts, where they list down a number of potential usecases of computer vision (CV) across various industries. 

Posting a few links below: 

https://viso.ai/applications/computer-vision-in-manufacturing/

https://viso.ai/applications/computer-vision-in-retail/

https://viso.ai/applications/computer-vision-in-healthcare/

Jotting down a few usecases, where we see traction in the industry: 

  • Quality inspection: CV can be used to inspect the final OEM product for quality defects - e.g. cracks on the surface, missing component in a PCB, dents on a metal surface, etc. Google has launched a specialized service for this called as Visual Inspection AI. 
  • Process monitoring: CV can ensure that proper guidelines are being followed during the manufacturing process - e.g. In meat plants, are knives steralized after each cut?, Are healthcare workers wearing helmets and hand gloves? Do workers keep the tools back in the correct location? You can also measure the time spent in specific factory floor areas to implement 'Lean Manufacturing'. 
  • Worker safety: Is a worker immobile for quite some time (potential accident?), Are they too many workers in a dangerous factory area? Are workers wearing proper protective gear? During Covid times, monitor the social distancing between workers and ensure compliance. 
  • Inventory management: Using drones (fitted with HD cameras) or even a simple smartphone, CV can be used to count the inventory of items in a warehouse. They can also be used for detecting unused space in the warehouse and automate many tasks in the supply chain.
  • Predictive maintenance: Deep learning has been used to find cracks in industrial components such as spherical tanks and pressure vessels.
  • Patient monitoring during surgeries: Just have a look at the cool stuff done by Gauss Surgical (https://www.gausssurgical.com/) With AI-enabled, real-time blood loss monitoring, Triton identifies four times more hemorrhages.
  • Machine-assisted Diagnosis: CV can help radiologists in more accurate diagnosis of ailments and detect patterns and minor changes far better than humans. Siemens Healthineers is doing a lot of interesting AI work to assist radiologists. More info can be found here -- https://www.siemens-healthineers.com/digital-health-solutions/artificial-intelligence-in-healthcare
  • Home-based patient monitoring: Detect human fall scenarios in old patients - at home or in elderly care centers. 
  • Retail heat maps: Test new merchandising strategies and experiment with various layouts. 
  • Customer behavior analysis: Track how much time a user has spent looking at a display item. What is the conversion rate?
  • Loss prevention: Detect potential theft scenarios - e.g. suspicious behavior. 
  • Cashierless retail store: Amazon Go !
  • Virtual mirrors: Equivalent of SnapChat filters where you can virtually try the new fashion. 
  • Crowd managment: Detect unsual crowds in public spaces and proactively take action. 
A huge number of interesting CV case studies are also available on roboflow's site here - https://blog.roboflow.com/tag/case-studies/